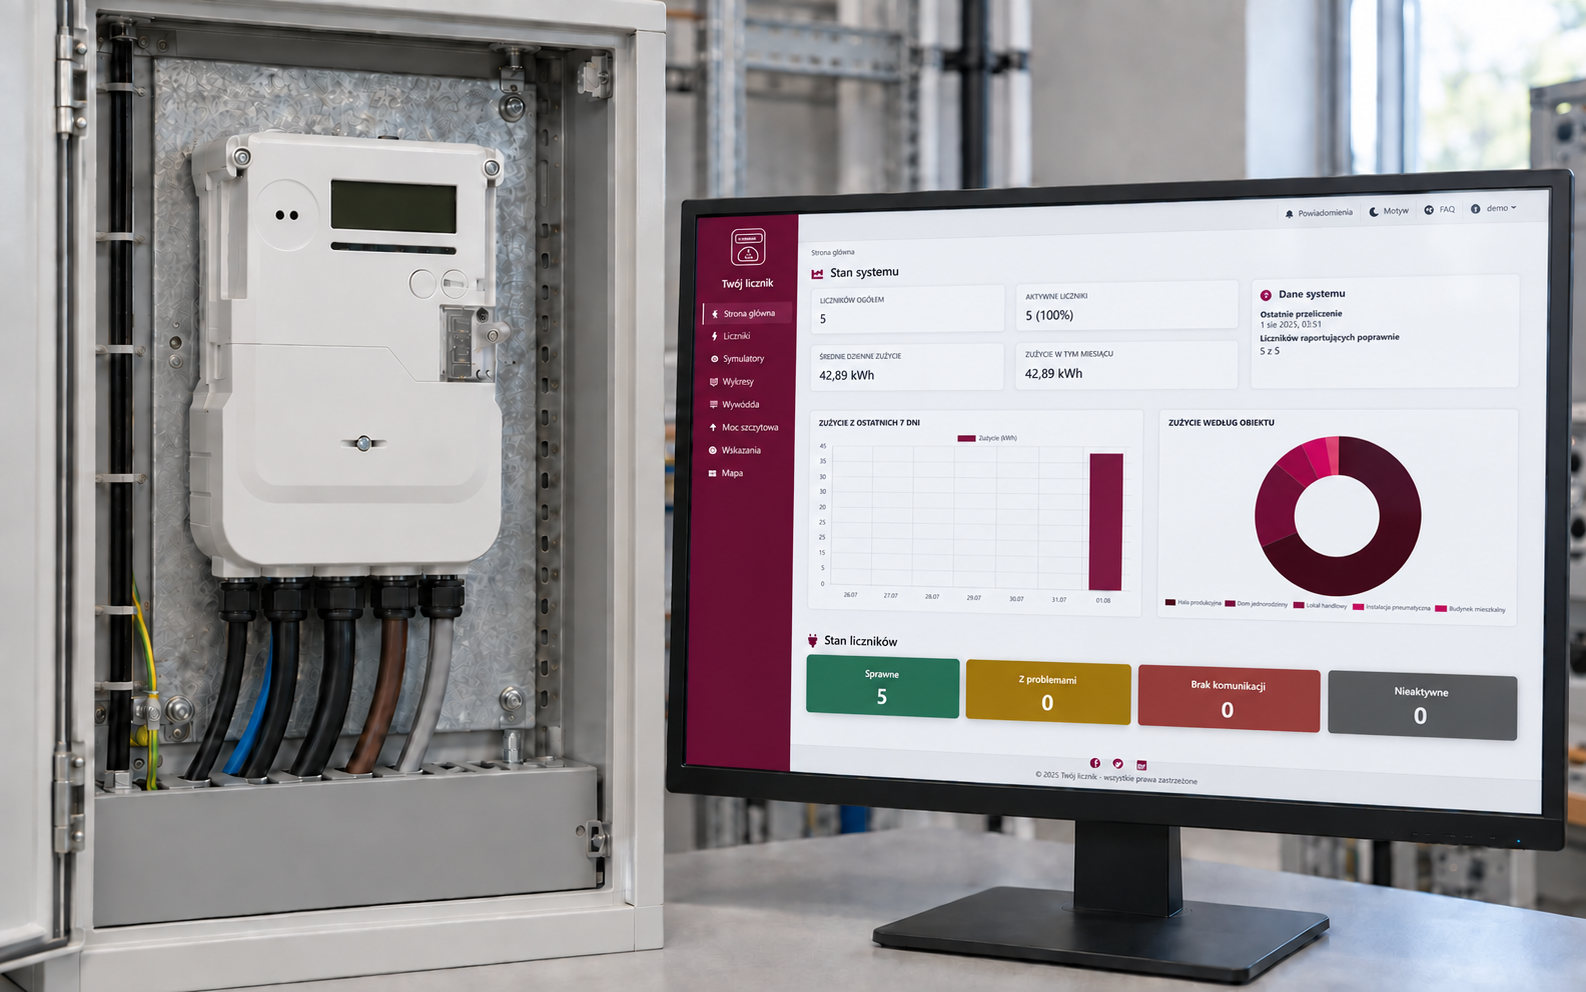
A web system for monitoring, registering and visualizing electricity meter data.
Delivered scope
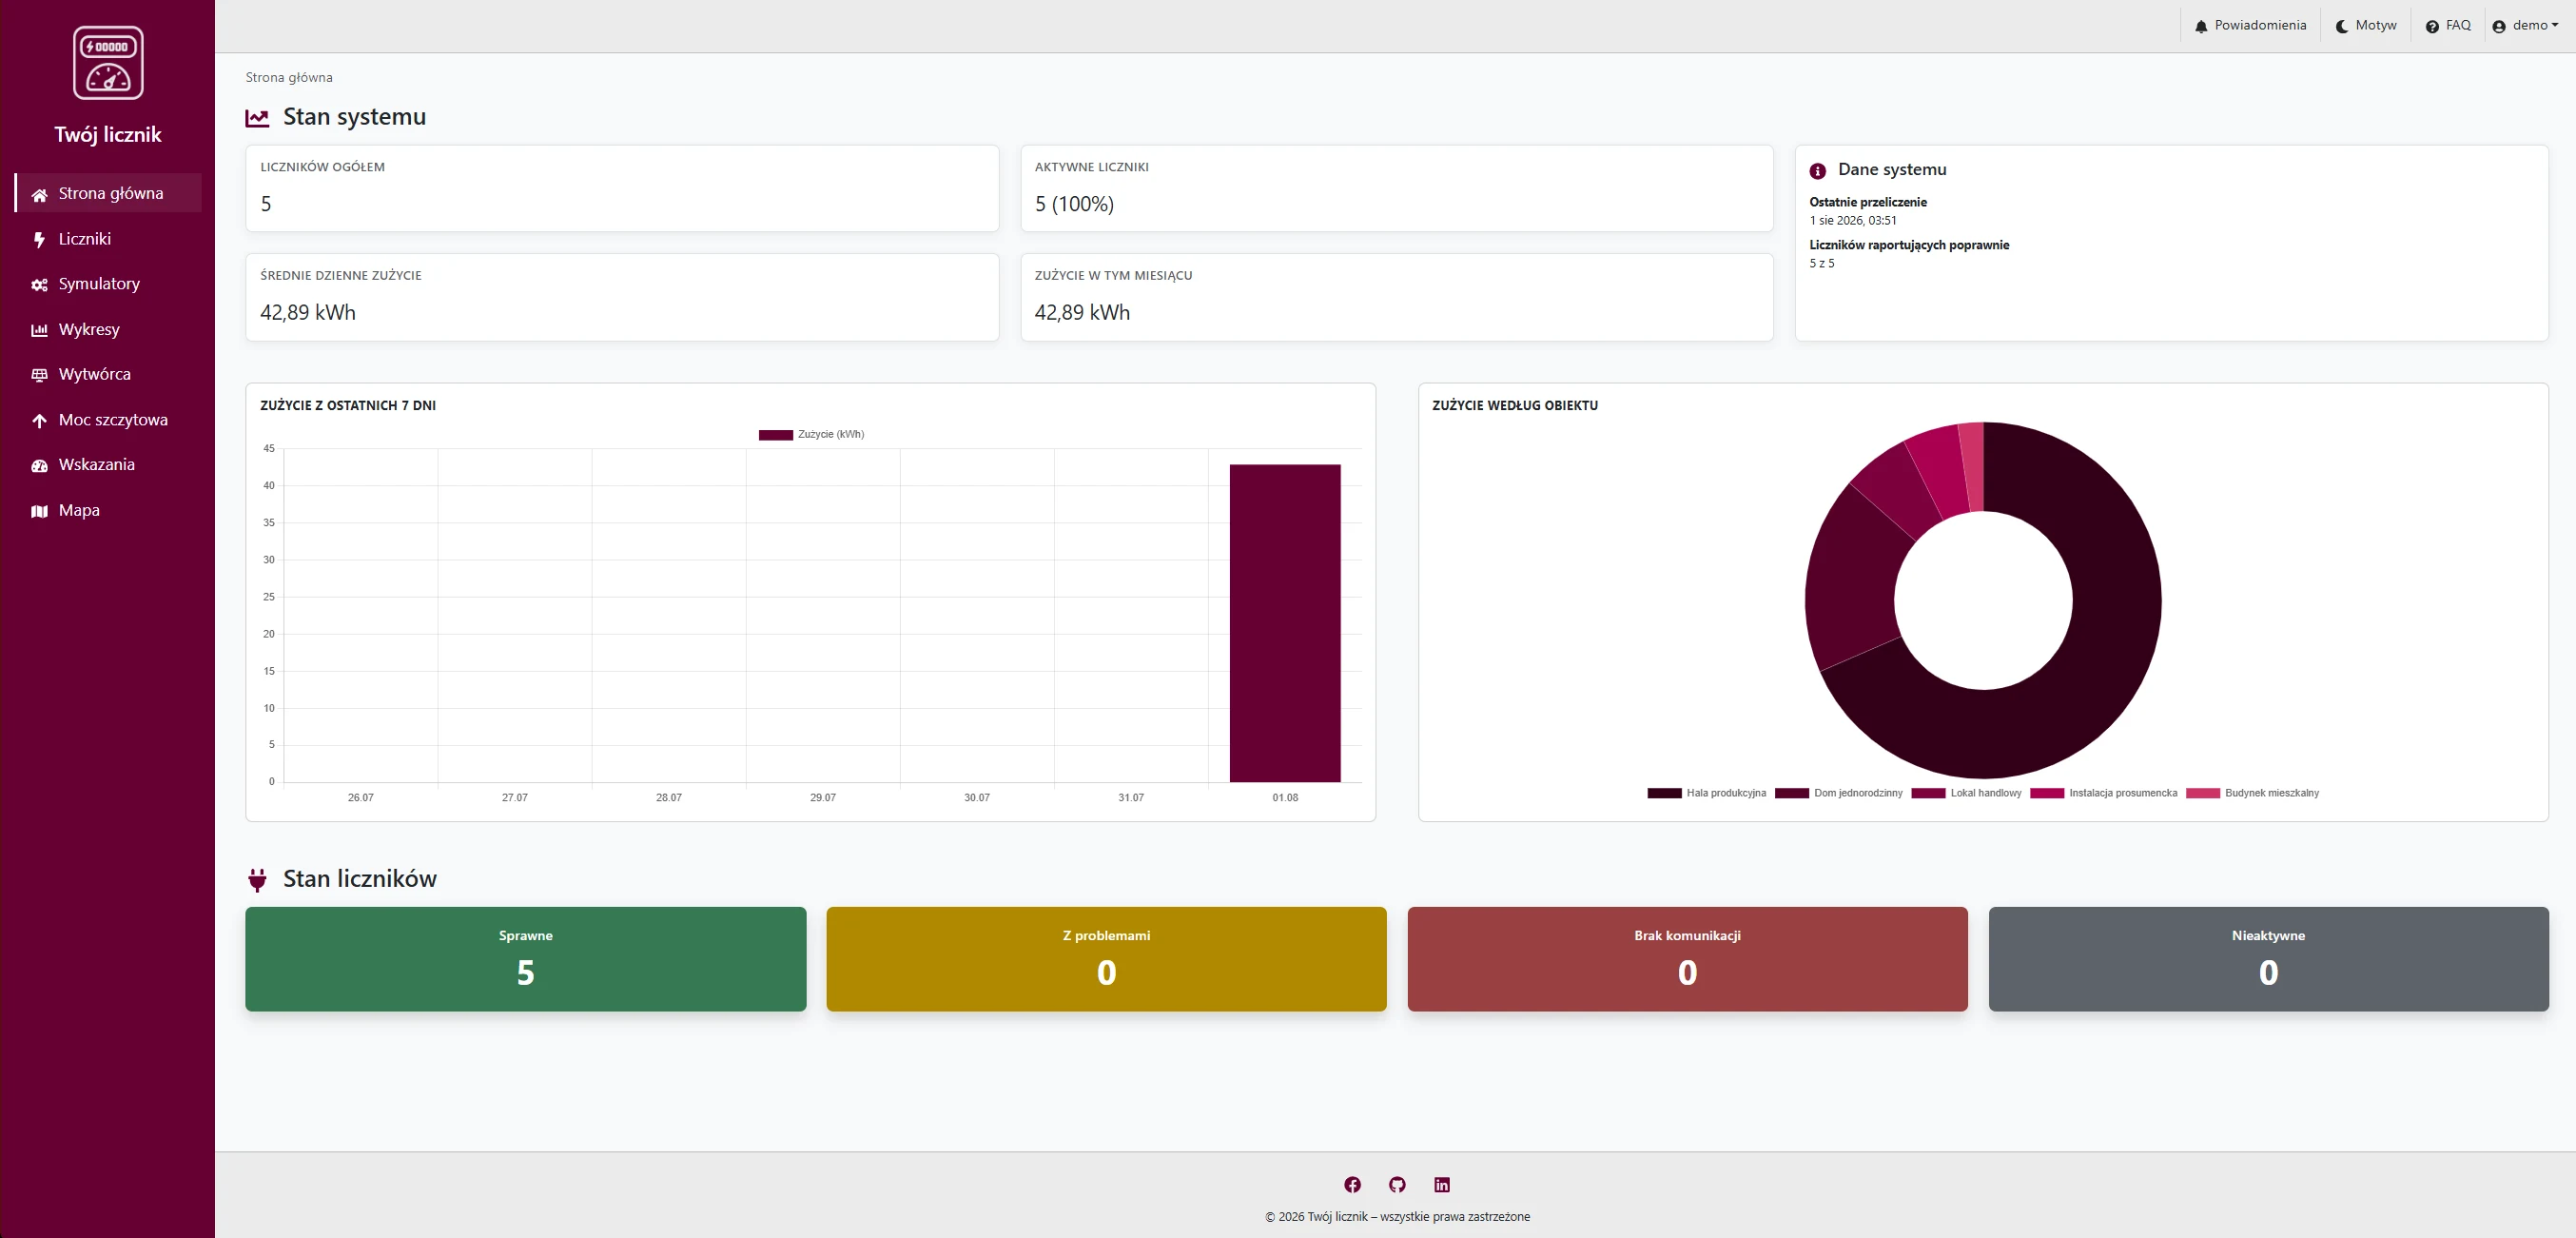
- Dashboard, meter inventory and reading views backed by API data
- ASP.NET Core 8 backend with EF Core, SQLite, migrations and HttpOnly sessions
- Device map and consumption, generation and power charts
- Meter registration, tariff simulators, read-only guest account and two themes
Concrete outcomes
- A working path from API measurement ingestion to dashboard and analytics views
- A persistent database with migrations and a separate guest mode
- A public application with the frontend on Cloudflare Pages and the backend under a dedicated API address
Problem
A large meter fleet generates data that is difficult to assess in a raw table. Users need a quick view of system health, consumption trends and the location and condition of individual devices.
Solution
Your Meter organizes data around daily workflows: a dashboard, meter inventory, readings, a map, a simulator lab and advanced analytics. The backend exposes protected endpoints for meters, readings, dashboards, users and simulators.
- Filterable and sortable meter inventory.
- Interactive map with device locations and status.
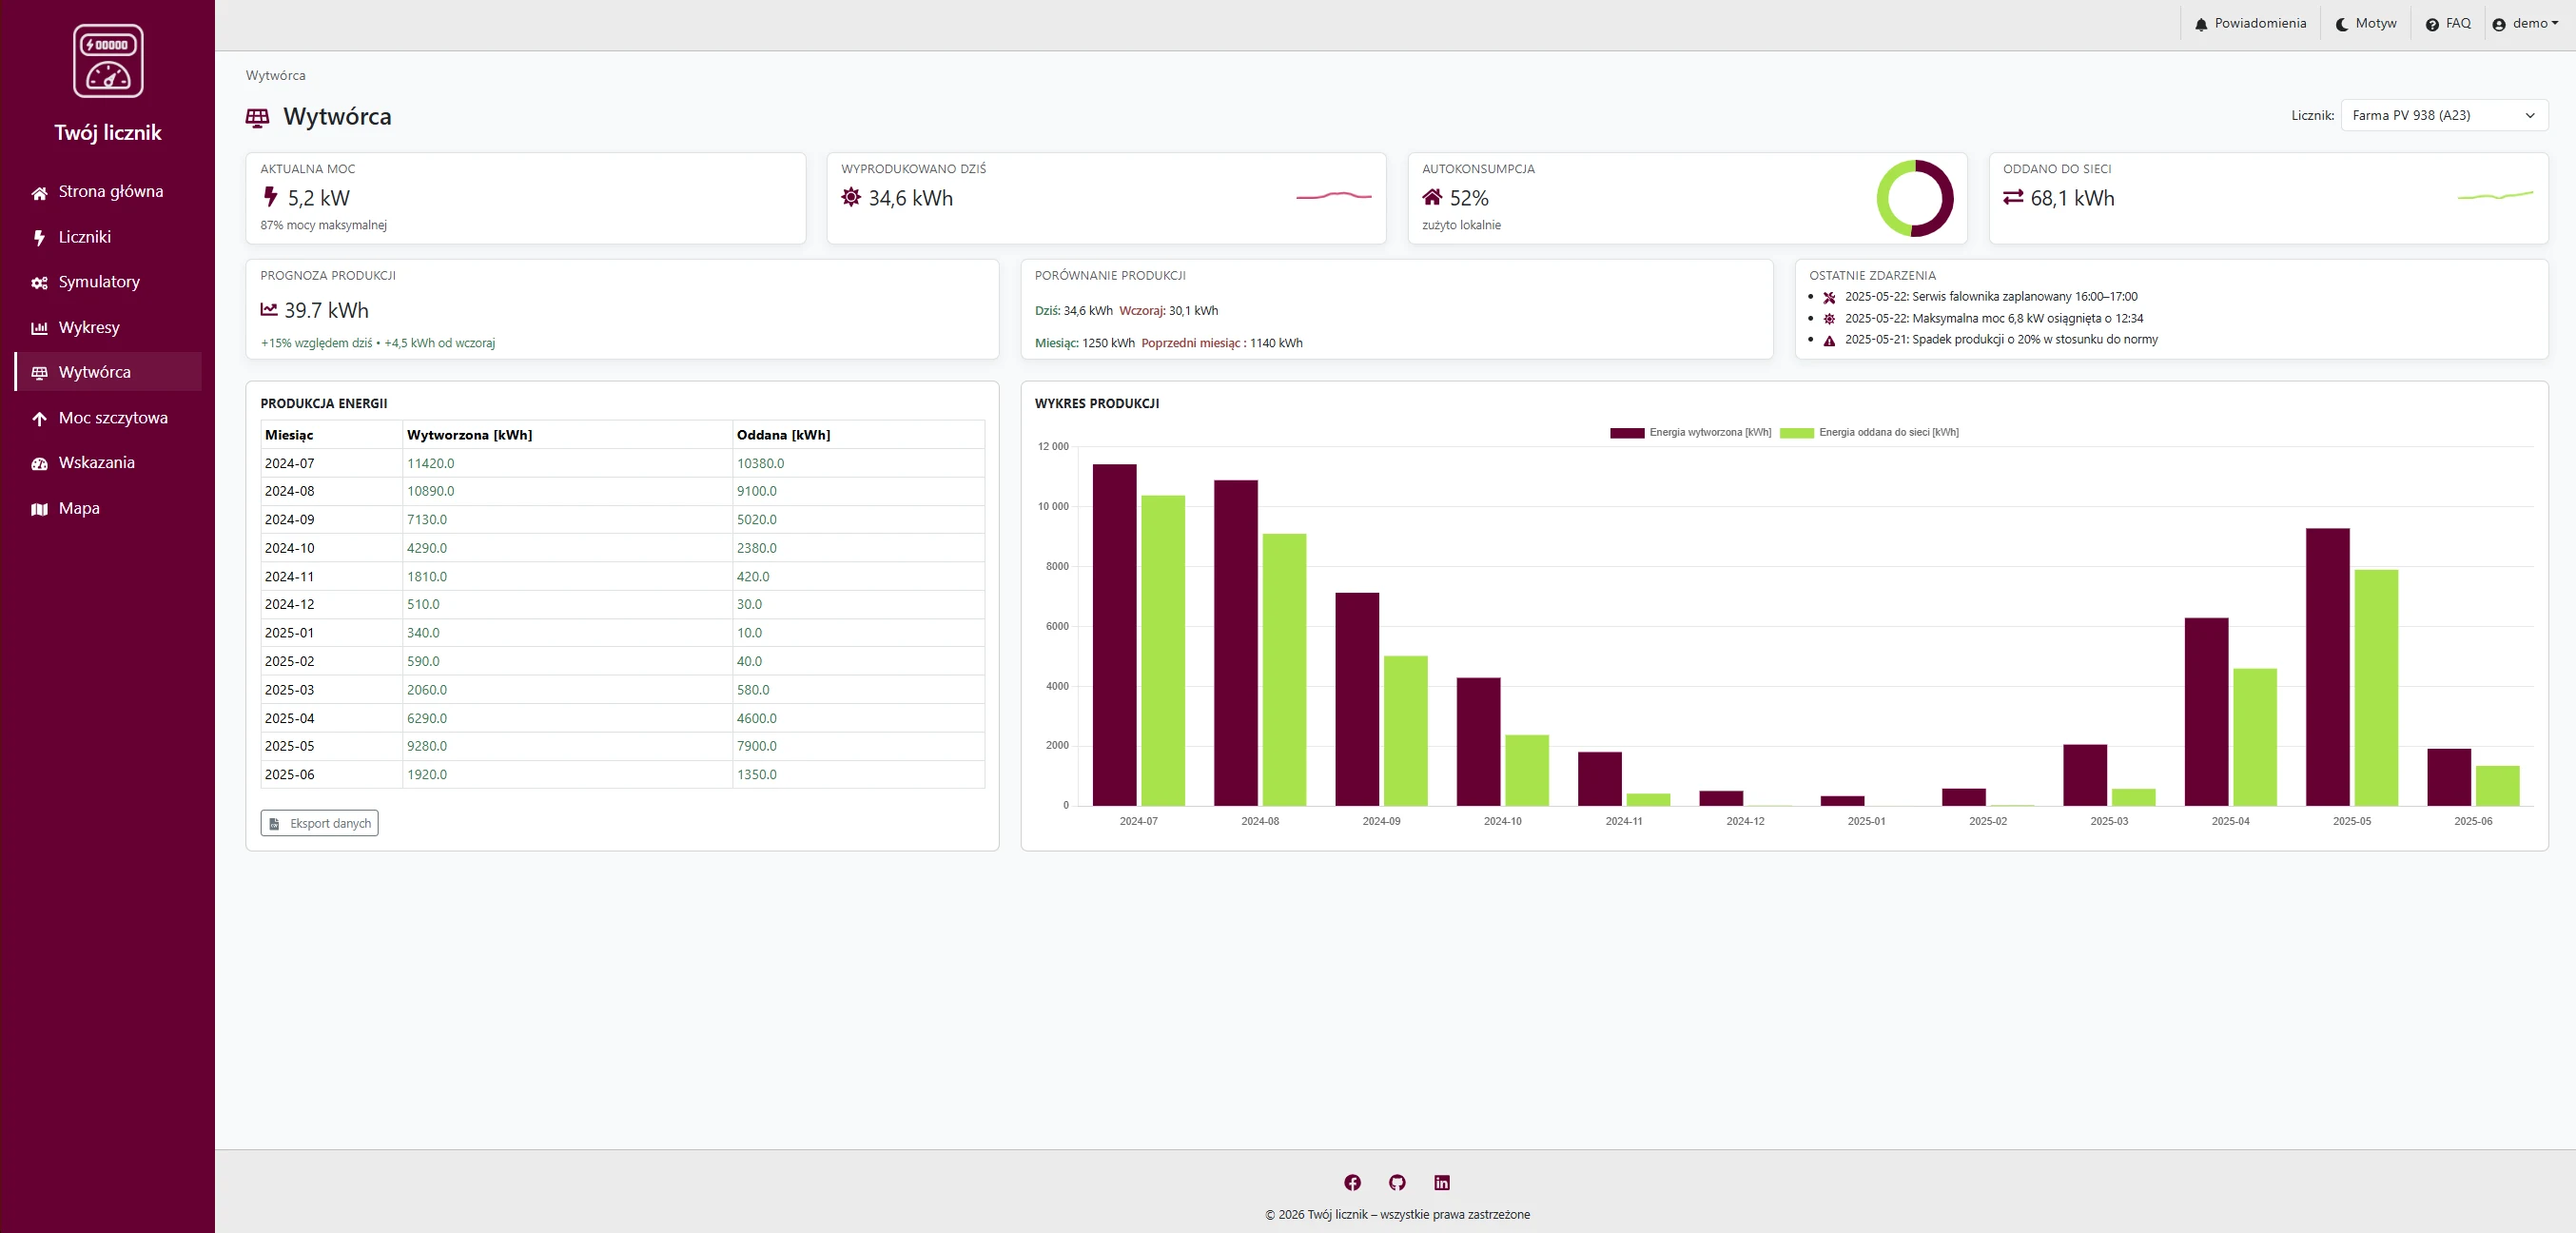
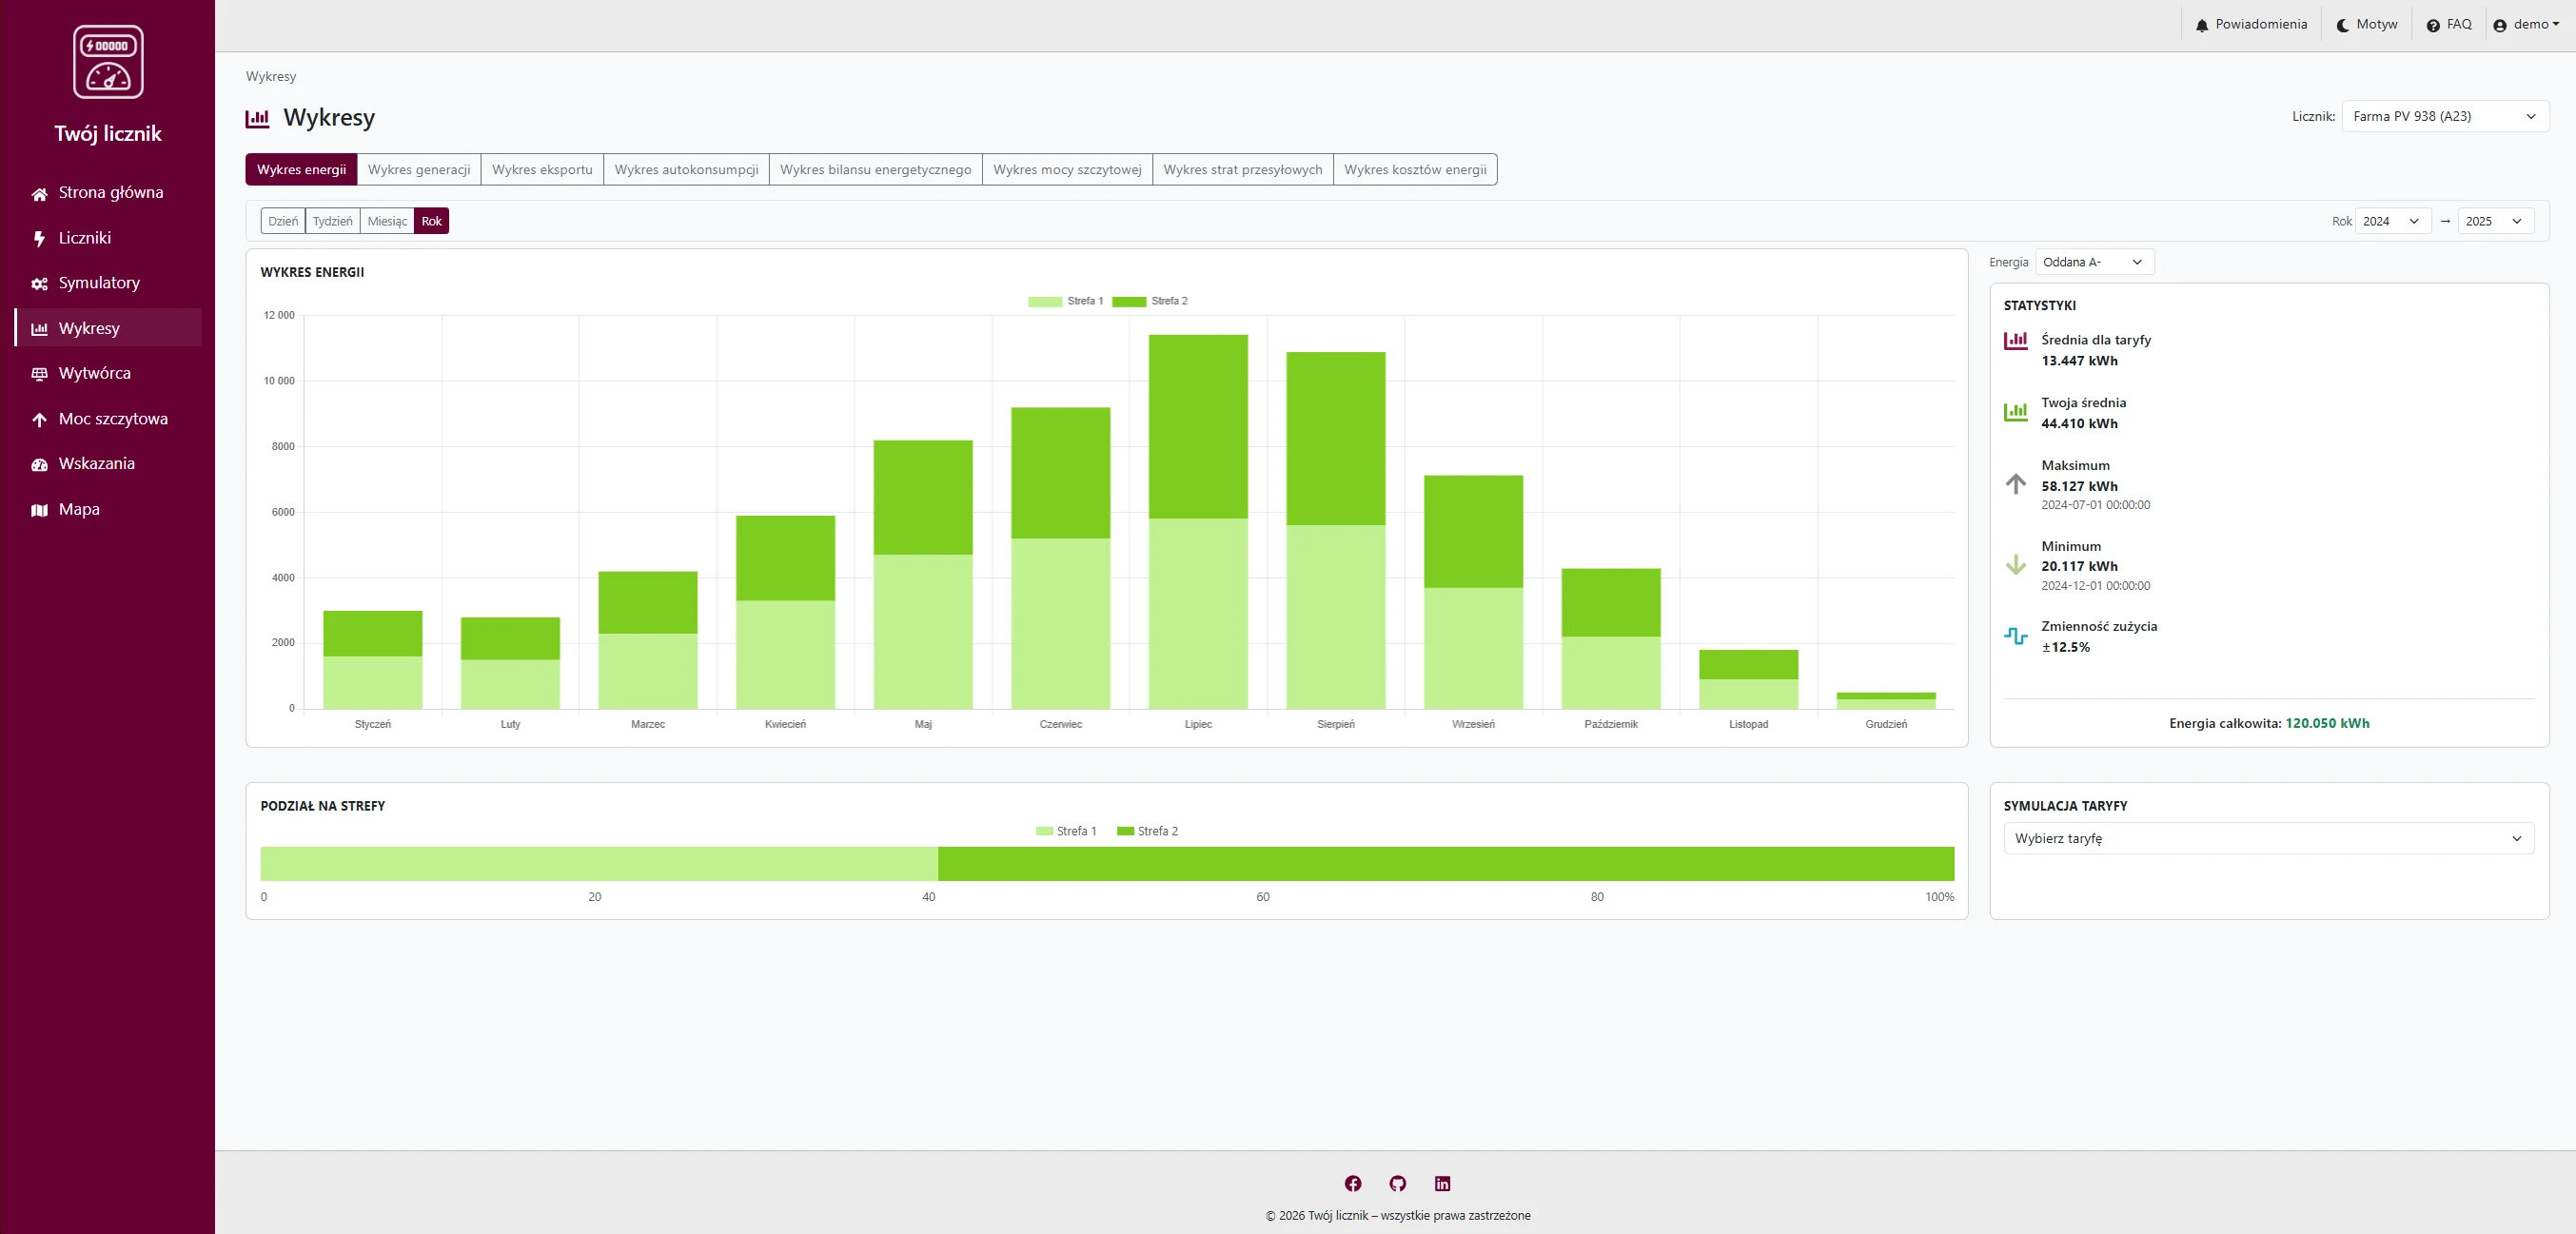
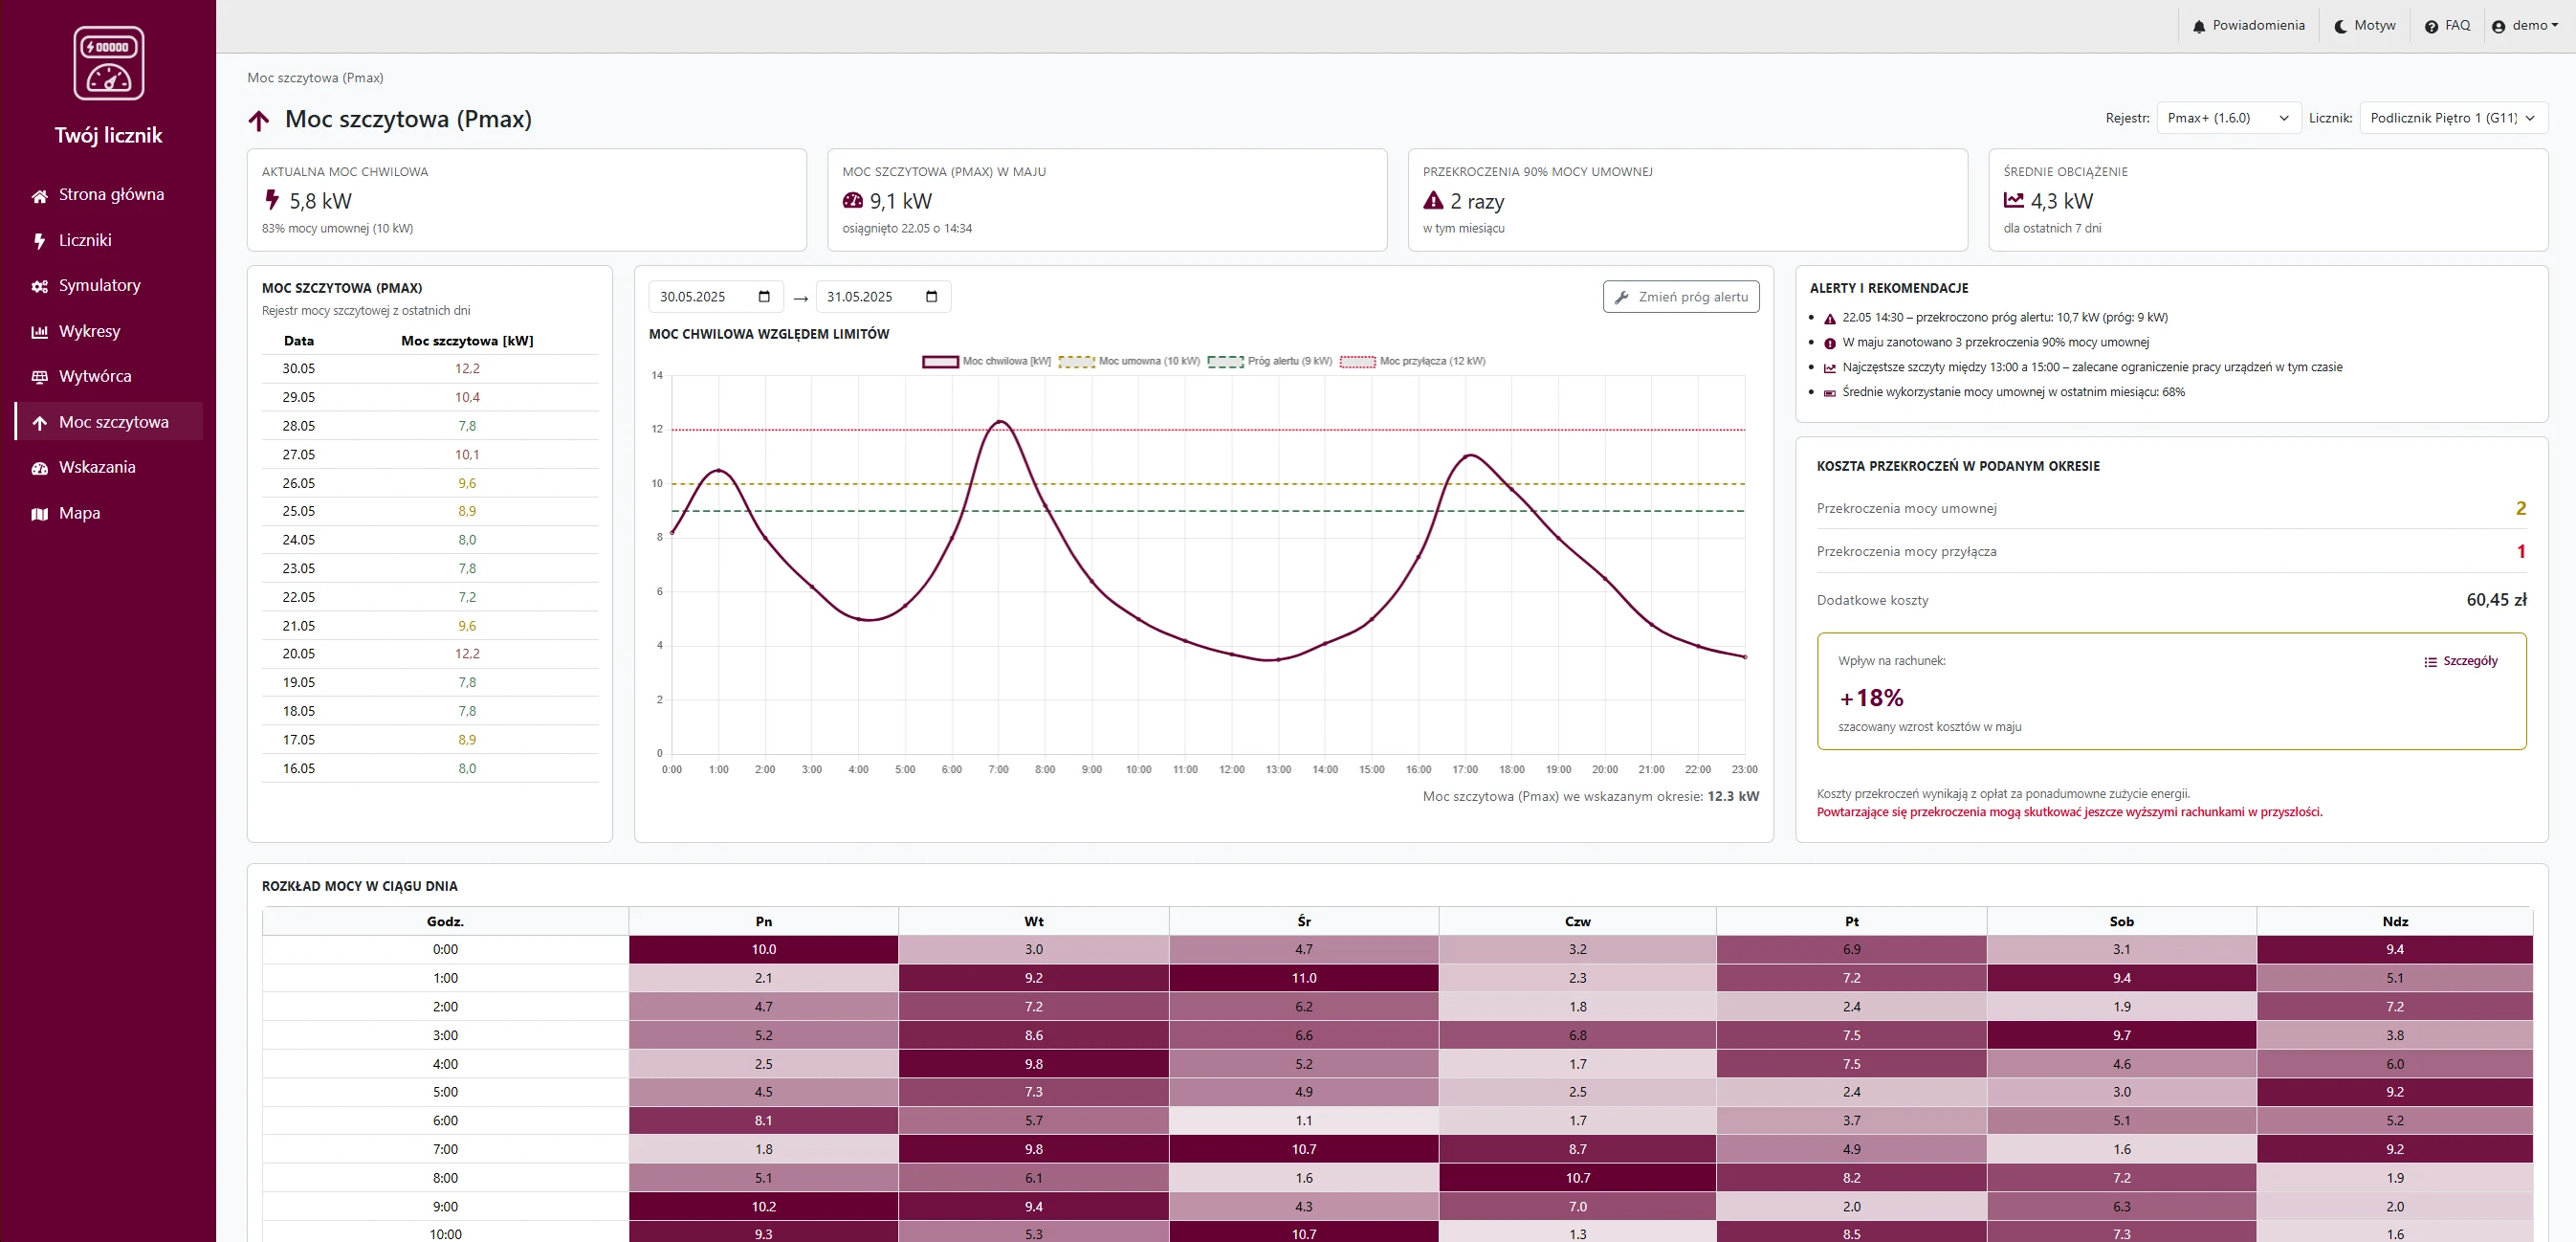
- Consumption, generation and power analysis charts.
- Custom column views for measurement data.
- Login, registration, user profile and a secure HttpOnly cookie session.
- G11, G12, G12W, C11 and A23 tariff simulators generating measurements for analysis.
Key decisions
The interface is organized around user tasks rather than table structure. Chart.js handles time-based comparisons, Leaflet adds geographic context and the API returns aggregates and lists calculated from records stored in the database.
Write operations require an active session and a custom application header, while the guest account is forced into read-only mode. This lets the public application show the system without allowing visitors to permanently change the data.
Result
The result is a working web application where the frontend uses the deployed API and a persistent SQLite database. The project shows both the operational meter layer and tooling for simulating energy data.